Skip to content

Understanding El Niño

What is El Niño?

El Niño and La Niña are opposite phases of a natural, recurring ocean-atmosphere cycle in the tropical Pacific called ENSO (El Niño-Southern Oscillation). During El Niño, surface waters in the central and eastern Pacific warm well above average; during La Niña, they cool below average. Each phase typically lasts 9 to 12 months or longer. So in short, El Niño is a climate pattern that causes the surface of the Pacific Ocean near the equator to become much warmer than usual.

Why it matters for SoCal

These temperature shifts move the position of the jet stream. In El Niño winters, that tends to push a wetter, more southerly storm track over Southern California: more rain, higher flood risk, and saturated hillsides prone to landslides. La Niña winters typically bring the opposite: a drier pattern shifted north. NOAA expects El Niño to keep strengthening through the end of 2026 and to remain strong through early 2027.

This winter's forecast

As of October 8, 2026, NOAA's Climate Prediction Center has an El Niño Advisory in effect. It gives a greater than 83% chance of a strong-to-very strong El Niño lasting through January–March 2027, and puts the chance of a historic event, one that would exceed every El Niño on record since 1950, at 83% for October–December. NOAA updates this forecast monthly; the next update is due November 12, 2026, so check the source directly for the latest numbers.

NOAA CPC ENSO Diagnostic Discussion (opens in new tab)

What about La Niña?

La Niña is El Niño's opposite phase: cooler-than-average water in the same equatorial Pacific region, and it's less predictable for Southern California than El Niño is. Historically, La Niña winters have delivered only about 80% of normal rainfall here, while Northern California is closer to a coin flip. The most recent La Niña was an unusually long "triple-dip" spanning three straight winters, 2020 through 2023, contributing to exceptional Southwest drought. The Pacific was still in a La Niña state as recently as winter 2025-26. This year's forecast El Niño is a rapid flip within a single year, a reminder of how fast this cycle can swing.

The ocean signal behind the forecast

A recurring term in this winter's coverage is the Kelvin wave: a pulse of unusually warm water that moves eastward along the equator across the Pacific over two to three months, often preceding or amplifying an El Niño's onset. Its appearance doesn't guarantee an El Niño event, but it's one of the leading subsurface signals forecasters watch.

Weekly sea surface temperature anomalies worldwide, November 30, 2025 to September 19, 2026. Over these weeks, water along the equator in the Pacific shifts from slightly cooler than normal (light blue) to much warmer than normal (orange to dark red), strongest off South America; white is within about half a degree Celsius of normal. This map shows surface warmth; Kelvin waves travel below the surface, so forecasters track them with subsurface data as well. Source: NOAA Physical Sciences Laboratory, via NOAA OSPO (opens in new tab).
NOAA Climate.gov: Oceanic Kelvin waves (opens in new tab)

Atmospheric rivers: the storms that actually deliver the rain

El Niño shifts the odds toward a wetter winter, but the actual storms that make that happen are usually atmospheric rivers: long, narrow bands of concentrated water vapor, sometimes called 'rivers in the sky,' that can carry as much water as the mouth of the Mississippi River. When one stalls over a Southern California watershed, it's what produces the intense, sustained rainfall behind most of the region's worst flooding and debris-flow events.

NOAA: What are atmospheric rivers? (opens in new tab)

Primary threats to communities

A strong El Niño winter raises three main risks across Southern California communities: flooding, landslides, and coastal damage from surge and erosion. Each has official safety guidance worth reading before the season starts.

Floods

Ready.gov notes that floods can develop slowly or quickly, that flash floods can come without warning, and that just six inches of moving water can knock a person down and one foot can sweep a vehicle away.

What drives it

Most of the region's worst flooding comes from atmospheric rivers (see above) stalling over a watershed. LA County describes the flood-control system it built in response to past floods, with the Los Angeles and San Gabriel rivers lowered, widened, and encased in concrete, as designed to move stormwater rapidly from the mountains to the ocean.

Why El Niño raises it

El Niño raises flood risk mostly by adding more storms over a season, not necessarily bigger single storms. The 1997-98 winter below brought roughly double the normal number of rainy days.

In Southern California

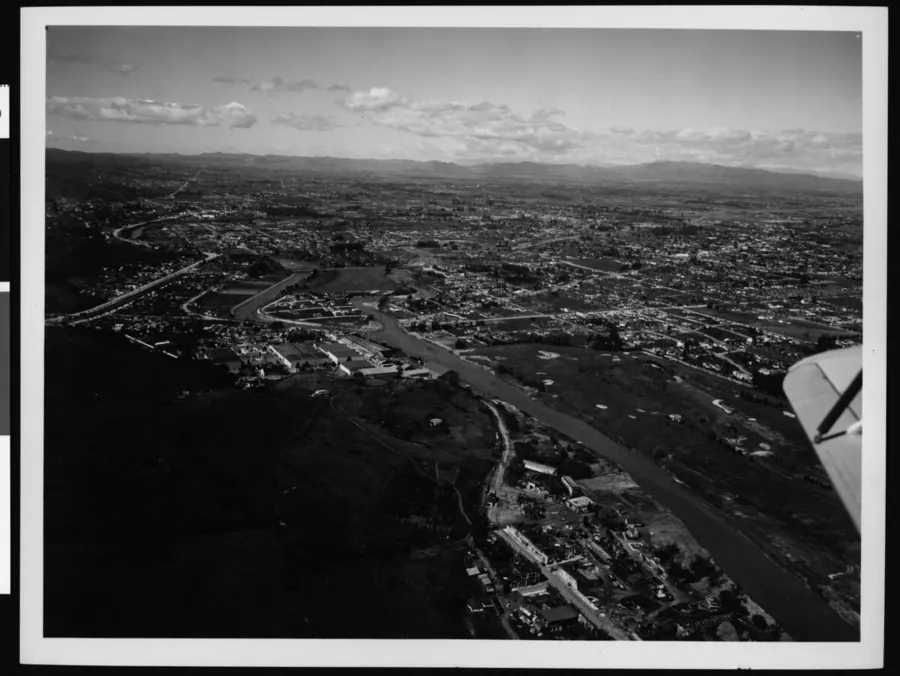
In 1938, a series of intense storms caused what LA County calls the most destructive flood in Southern California's recorded history; more than 100 people died. According to LA County, the concrete channels, dams, and debris basins built afterward prevented similar catastrophes in 1969 and 2005, when river volumes exceeded the levels that led to the 1938 flood.

Landslides & Debris Flow

Ready.gov describes saturated hillsides, especially recent burn scars, giving way during heavy rain and sending mud, rock, and debris downhill with little to no warning.

What drives it

These are two related but different processes. Landslides on saturated slopes build up over a wet season: USGS documented the deadly 2005 La Conchita slide at the end of 15 days of near-record rain. Post-fire debris flows are triggered by short, intense bursts: USGS reports that in Southern California, as little as 0.3 inches of rain in 30 minutes has triggered debris flows on recently burned slopes.

Why El Niño raises it

A wet El Niño season can add to both: more cumulative rain soaking slopes, and more storms that could bring an intense burst over a burn area.

In Southern California

At La Conchita in Ventura County, on January 10, 2005, part of a 1995 landslide moved again, destroying or seriously damaging 36 houses and killing 10 people. Above Montecito in Santa Barbara County, on January 9, 2018, an intense burst of rain on the Thomas Fire burn area triggered debris flows that killed 23 people and damaged 408 homes. Neither happened during one of the strong El Niño winters listed below, a reminder that saturated slopes and burn scars carry risk in any wet winter.

Coastal Flooding & Erosion

High surf, king tides, and storm systems can push seawater inland along the coast, flooding low-lying neighborhoods and damaging coastal infrastructure. The same waves also strip sand from beaches, which is how coastal erosion happens.

Peninsula, Long Beach, September 8, 2026: waves overtopping the seawall.
Capistrano Beach, Dana Point, September 9, 2026: surf reaching the rock wall in front of beachfront homes.
Peninsula, Long Beach, September 8, 2026: broken boardwalk planks behind caution tape.
Video credit: Greg Bixby (independent videographer; not otherwise involved in StayReadySoCal nor responsible for its content)

What drives it

Coastal damage is driven mainly by waves and water levels rather than rainfall. USGS found a significant link between the total wave energy reaching the coast over a winter and how far California shorelines retreated.

Why El Niño raises it

USGS notes that El Niño winters can produce larger waves that pull more sand offshore. During the 2015-16 El Niño, winter beach erosion at 29 West Coast beaches ran 76% above normal, the highest ever recorded, and most California beaches eroded beyond historical extremes.

In Southern California

A USGS statewide analysis found that 79% of Southern California beaches eroded during the 2015-16 winter, with an average shoreline retreat of about 9.7 meters (32 feet), in a season that brought the region below-normal rain. USGS also notes that after the 1997-98 El Niño, some beaches took a decade to recover.

Why liquefaction appears on this site

Hazard Lookup and Prep include liquefaction because California maps it by address, alongside earthquake-induced landslides, in the California Geological Survey's EQ Zapp (opens in new tab). It isn't an El Niño hazard: USGS describes it (opens in new tab) as something that happens during the intense shaking of an earthquake. See the agency resources for liquefaction on the Prep page.

Secondary hazards

Beyond the direct hazards, severe storms often trigger a second wave of disruption. Heavy wind and rain can knock out power for hours or days, and cell towers can lose service right when you need to reach emergency lines or check alerts. If a line comes down, see the downed power line safety guidance on the Prep page. Flooded and debris-covered roads may close with little notice, cutting off routes to work, school, or medical care. Storm drains clogged with debris back up quickly, turning streets into standing water even after the rain stops. Runoff can also contaminate drinking water sources, and it carries bacteria, chemicals, trash, and debris, including submerged branches and logs, from streets and storm drains into the ocean. Health departments in Los Angeles, Orange, San Diego, and Ventura counties all issue rain advisories after significant rain and advise staying out of the ocean for at least 72 hours after the rain ends, especially near storm drains, creeks, and rivers. Check current beach conditions for LA County (opens in new tab), Orange County (opens in new tab), San Diego County (opens in new tab), or Ventura County (opens in new tab). And while most sinkholes form slowly, USGS notes (opens in new tab) they can form suddenly when a collapse occurs.

Power outages
Road closures
Standing water
Contaminated water
Unsafe ocean water
Sinkholes

West Nile virus is active this fall

In September, LA County Public Health reported its highest number of West Nile virus cases this early in mosquito season in nearly a decade (LA County Public Health (opens in new tab)). Winter storms didn't cause this fall's surge, but standing water left behind after rain can add mosquito breeding sites: the Greater Los Angeles County Vector Control District notes that mosquitoes keep breeding through our mild winters, and advises checking for standing water every week and after every rain. Tip out buckets, clogged rain gutters, rain barrels, old tires, and anything else that holds water, change water in pet dishes and birdbaths often, and wear EPA-registered insect repellent outdoors (GLACVCD mosquito prevention (opens in new tab)).

How past strong El Niños actually played out

A strong ocean reading doesn't guarantee a specific local outcome. Here's how the last four comparably strong events actually played out for Southern California.

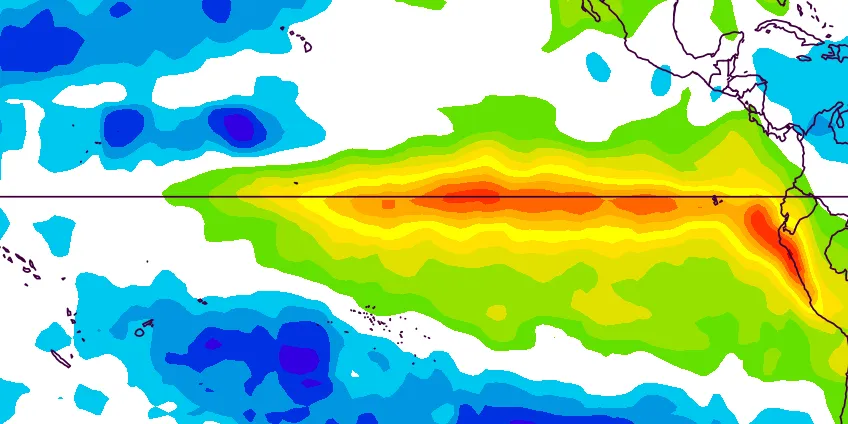
Map of Pacific sea surface temperature anomalies in December 1982, showing a broad band of warmer-than-normal water along the equator from the central Pacific to South America.

Ocean surface temperature, December 1982

1982-83

One of the strongest El Niños on record. Downtown LA received 31.25" of rain against a 14.25" normal. Near-record statewide rainfall spread across many storms caused $2.25 billion in damage (2023 dollars) without any single catastrophic event.

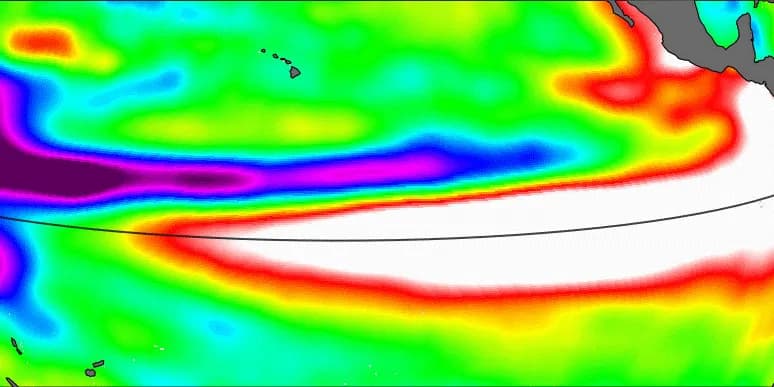
Satellite map of Pacific sea levels in early October 1997, showing higher-than-normal water across the central and eastern equatorial Pacific.

Pacific sea level, October 6, 1997

1997-98

Downtown LA received 31.01" of rain against a 14.25" normal. California's wettest winter on record by rainfall volume, yet ranked only 13th-costliest for flood damage, because the rain fell across roughly double the normal number of rainy days instead of a few intense storms.

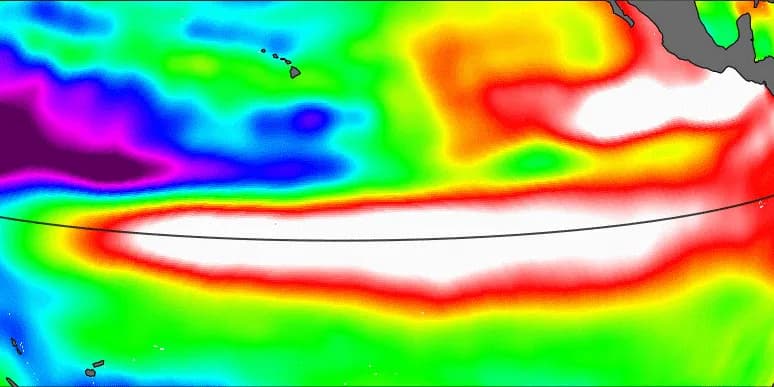
Satellite map of Pacific sea levels in early October 2015, showing higher-than-normal water across the central and eastern equatorial Pacific, similar to 1997.

Pacific sea level, October 5, 2015

2015-16

Nicknamed the "Godzilla El Niño" for its ocean temperatures, among the strongest ever measured, but Southern California actually received below-normal rainfall that winter.

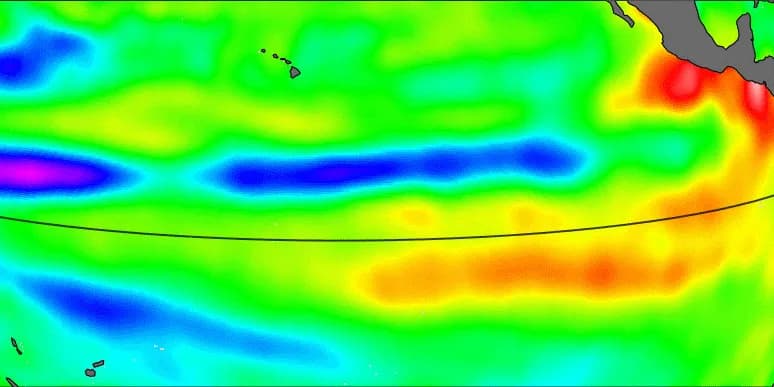
Satellite map of Pacific sea levels in early October 2023, showing a smaller, weaker area of higher-than-normal water than in 1997 or 2015.

Pacific sea level, October 2, 2023

2023-24

A more recent strong El Niño that did bring significantly above-average coastal rainfall to Southern California, with widespread, damaging landslides.

Maps show conditions as each El Niño developed. The 1997, 2015, and 2023 maps show sea level in early October (red and white: higher than normal; blue and purple: lower). The 1982-83 map shows ocean surface temperature in December 1982 (green through red: warmer than normal; blue: cooler; white: near normal), since satellite sea-level records begin in 1992. Images: NASA/JPL-Caltech (opens in new tab); NOAA Physical Sciences Laboratory (opens in new tab).

Downtown LA rainfall figures are July–June seasonal totals against the 1991–2020 normal, from the LA Almanac (opens in new tab).

Same strength reading, four different outcomes for Southern California, which is why this site tracks the season's actual storms and official hazard tools, not just the seasonal odds.

El Niño and climate change: what's natural and what's changing

El Niño is natural. Climate change is real. Both are true at once, and they connect in specific ways: some well understood, some still being studied.

What's natural

El Niño is a natural cycle, and it's far older than modern warming: the 2026 coral study described in the third card compared recent El Niños against the past 1,000 years of records, with fossil corals reaching back 4,500 years (opens in new tab). Big Southern California floods are old too; the 1938 flood described above came long before modern warming accelerated. Scientists agree on all of this. It just isn't evidence about climate change in either direction, because climate change doesn't create El Niño. It changes the conditions El Niño plays out in.

Black-and-white aerial photo of the flooded Los Angeles River at the Lankershim Boulevard bridge in 1938, with the plane's wingtip in the foreground and the city and mountains beyond.

The Los Angeles River at Lankershim Boulevard during the 1938 flood, March 2, 1938. Photo: 115th Photo Section; University of Southern California Libraries and California Historical Society (opens in new tab), public domain.

What warming changes

NASA reports that Earth's average surface temperature has risen about 2°F since the late 19th century, a change driven largely by increased carbon dioxide emissions into the atmosphere and other human activities, and that global sea level rose about 8 inches in the last century (NASA (opens in new tab)). Warmer air holds about 7% more water vapor per degree Celsius, so more water is available to fall in heavy storms (NCICS (opens in new tab)). For California, a 2019 Scripps-led study found that all 16 climate models it examined project heavy precipitation coming more from atmospheric rivers, in less frequent but more extreme bursts (Scripps Institution of Oceanography (opens in new tab)). The same study projects California swinging more sharply between drought and flood, the 'whiplash' described in the wildfire section. Higher seas also mean the same storm surge starts from a higher line.

What's still uncertain

Whether warming is changing El Niño itself is an open question. The IPCC's 2021 assessment found El Niño stronger since 1950 than before, but no clear evidence the change was unusual or human-caused, and climate models disagree on how it will change. It also calls it virtually certain that El Niño will keep occurring in a warming world (NOAA Climate.gov (opens in new tab)).

A 2026 study found that El Niños of the past 40 years were stronger on average than at any time in 1,000 years of Galápagos coral records (Science (opens in new tab)). One of its authors links this to human-caused warming, while noting that not all climate models agree (The Conversation, via WLRN (opens in new tab)).

Either way, a stronger El Niño doesn't guarantee a wetter winter here: 2015-16 was one of the strongest on record and brought Southern California below-normal rain (see Past strong El Niños).

If floods and strong El Niños happened before, is climate change real?

Yes. Past floods show that El Niño and big storms are natural, which scientists agree on. Climate change is measured differently: in long-term records of temperature, sea level, and ocean heat that NASA and NOAA track worldwide. Even NOAA's switch to the RONI index for measuring El Niño, described in Research & resources below, was made because, in NOAA's words, “as tropical ocean temperatures shift over time,” the old index's 30-year reference “can lag behind current conditions.” A natural cycle on a warmer planet with higher seas: both are true.

You don't need to settle this question to prepare. Flood maps, county alerts, and sandbags work the same either way.

Check official hazard tools for your address →

The wildfire season this sets up

A historically wet El Niño winter doesn't end its influence in spring. Heavy rain drives rapid growth of grasses and brush across Southern California's hillsides; when the dry season returns, that same vegetation dries into fuel. Climate researchers call this swing between extremes 'hydroclimate whiplash,' and it's a documented factor behind some of California's most destructive recent fire seasons. A wet winter is worth celebrating for drought relief, but it's also the first half of a story that continues into next fire season.

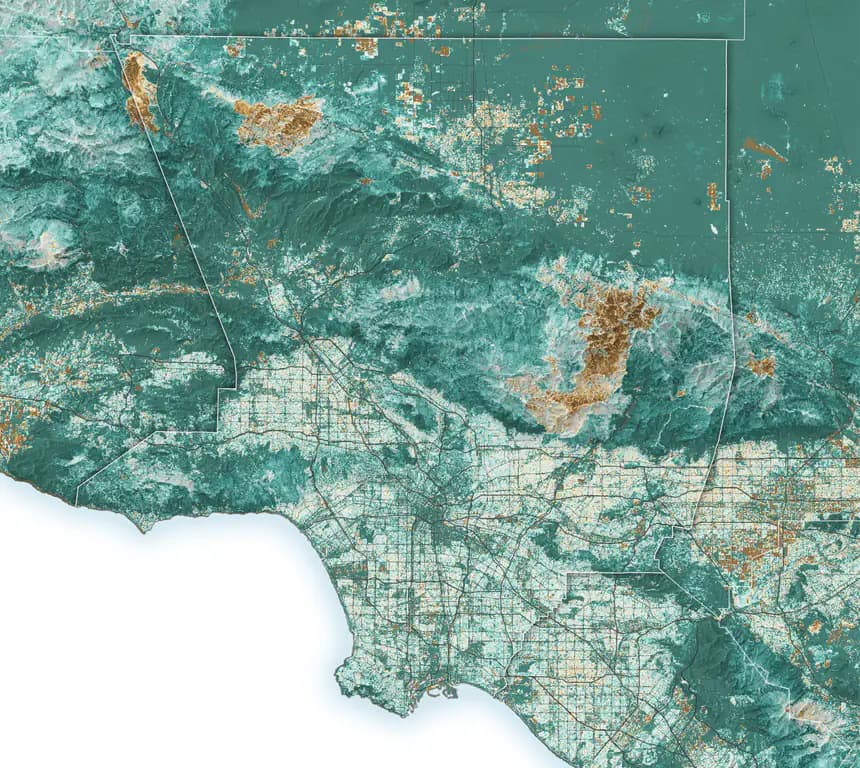
Satellite map of Los Angeles County showing vegetation much greener than average in summer 2024, especially across the mountains and foothills.

Summer 2024: after two wet winters, many parts of Los Angeles County were about 30% greener than the 1991–2020 average. Teal is greener than average; brown is less green.

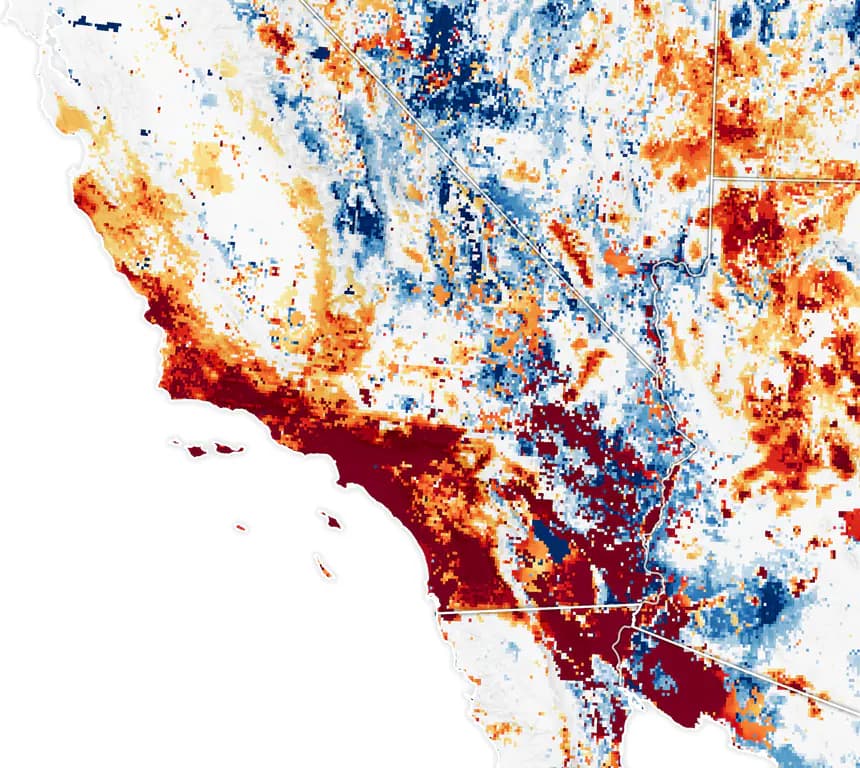
Map of Southern California soil moisture on January 7, 2025, with the Los Angeles area among the driest on record for that date.

January 7, 2025: the day the Palisades and Eaton fires started, soil moisture across much of Southern California was in the bottom 2% of historical records. Dark red marks the driest 2%; blue is wetter than normal.

The same vegetation that grew during the wet years had dried out by winter. Images: NASA Earth Observatory (opens in new tab), using Landsat data from the U.S. Geological Survey and soil moisture data from NASA's SPoRT Center.

Understanding why this is happening is only half of it. The Prep page has an emergency kit checklist and county alert sign-ups; Hazard Lookup routes you to the official tools for checking your own address's flood, landslide, and coastal risk this winter, including the USGS Post-Fire Debris-Flow Hazard Assessment Viewer for burn-scar debris-flow risk specifically.

Go deeper

Research & official resources

NOAA's Climate Prediction Center now tracks ENSO strength using RONI (the Relative Oceanic Niño Index) instead of the older ONI. ONI compares ocean temperatures to a fixed 30-year average, which, NOAA says, can lag behind current conditions as tropical ocean temperatures shift over time; RONI compares the same region to global tropical temperatures instead, making it more responsive in real time (NOAA CPC: RONI announcement (opens in new tab)). If you see both terms in the news, RONI is the newer, currently official one.

NOAA

NOAA CPC ENSO Diagnostic Discussion

The official monthly advisory that tracks and forecasts El Niño/La Niña strength.

NOAA

NOAA Climate.gov: ENSO Explained

NOAA's plain-language explainer on how El Niño and La Niña work.

NOAA

NOAA Relative Oceanic Niño Index (RONI)

Historical strength data for every El Niño and La Niña since 1950, using NOAA's current official index.

NOAA

NOAA Climate.gov: ONI/SST Dashboard

An interactive chart of Pacific sea-surface-temperature anomalies over time.

If StayReadySoCal is useful to you, consider buying us a coffee!